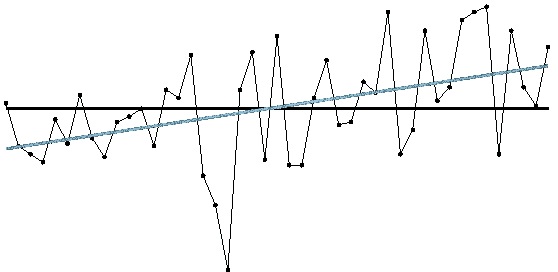
Trend
Etymology
Middle English, to turn, revolve, from Old English trendan; akin to Middle High German trendel disk, spinning top
- Date: 1598
Definitions
- 1 a : to extend in a general direction : follow a general course <mountain ranges trending north and south>
- b : to veer in a new direction : bend <a coastline that trends westward>
- 2 a : to show a tendency : incline <prices trending upward>
- b : to become deflected : shift <opinions trending toward conservatism>
Description (Finance)
A trend line is formed when you can draw a diagonal line between two or more price pivot points. They are commonly used to judge entry and exit investment timing when trading securities. It can also be referrd to a dutch line as it was first used in Holland.
A trend line is a bounding line for the price movement of a security. A support trend line is formed when a securities price decreases and then rebounds at a pivot point that aligns with at least two previous support pivot points. Similarly a resistance trend line is formed when a securities price increases and then rebounds at a pivot point that aligns with at least two previous resistance pivot points. The following chart provides an example of support and resistance trend lines:
Trend lines are a simple and widely used technical analysis approach to judging entry and exit investment timing. To establish a trend line historical data, typically presented in the format of a chart such as the above price chart, is required. Historically, trend lines have been drawn by hand on paper charts, but it is now more common to use charting software that enables trend lines to be drawn on computer based charts. There are some charting software that will automatically generate trend lines, however most traders prefer to draw their own trendlines.
